This is an updated “How To” originally posted in October 2013 on ‘jonah’s maps’ . It’s also now available has a GitHib Repo!
Let’s say you’re asked to help with the cartography of a story map, or you want to create some web maps that just stand out. The current offering of basemaps within ArcGIS Online are ‘ok’, some are more of a complete map than others - so it’s hard to control the visual hierarchy of your layers - there’s that weird sandwich layer thing where if you don’t add a second layer of labels for places and such any data you add will cover the labels burned into the basemap. (Some of the basemaps do this for you, some don’t) Basically, it’s like putting the mayo on top of your sandwich. There have been some previous posts on using outside basemaps and changing the predefined basemap colors, which helped me get started, but I wanted to expand on that topic a little more.
All of these options work off of AGOL’s ability to add a tile layer from the web.
- Caveat: you can create maps/tiles in arcgis desktop. The tile creation/upload process (for me) was pretty painful compared to tilemill - mostly because I didn’t have access to ‘ArcGIS For Server’ or an organization level ArcGIS Online account.
TileMill
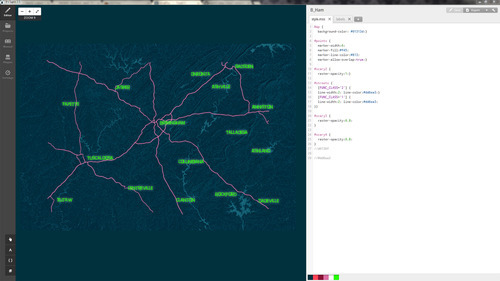
Tilemill “is a modern map design studio” that allows you to use gis data to create map tiles, among many other things. It’s also open source and Available On GitHub. Using CartoCSS, you can style your data as desired, choose your zoom levels, then upload the tiles to your Mapbox account. (You can also download tiles to use as well). With a free account, you have 50mb of space and up to 3k views per month. I’ve been able to create several US and World styles up to zoom level 5 with tile sizes under 1mb. Just keep in mind your data audience, your cities street light points probably only need a few zoom levels, and don’t need to be seen on a world map. Your tiles are stored as a Mapbox ‘project’ in your account, and the link you need for AGOL is on the project info window, when viewing your tiles.
MapBox
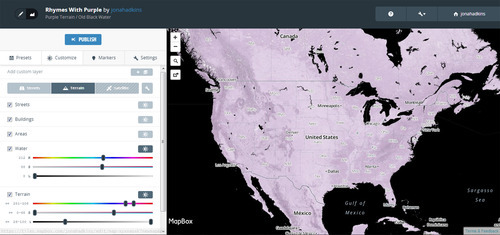
Mapbox is a “platform gives developers the power to make maps that embody their product and brand.” With a Mapbox account, you can start a project, choose a basemap style (streets, terrain, satellite), and use interactive color sliders to re-color/style the map as desired. Yes, you can change the color of the basemap! Same as your Tilemill project, the link you need for AGOL is on the project info window. You can see a sample of project in AGOL here.
- Caveat: To use the satellite layer within a Mapbox project requires a Basic/$5 per month account.
Stamen
Another popular creator of map services is Stamen. You are probably most familiar with their watercolor map tiles, but they also have several others that can be consumed in many ways through ArcGIS. Like Mapbox, you can specify subsets of their basemaps when adding a tile layer, which allow you to intelligently layer their maps with your data. For instance the Toner map service they offer is available in six (WOW!!) flavors: standard toner, hybrid, labels, lines, background, and lite.
One of their really cool projects is MapStack, dubbed the ‘Instagram’ for maps, it allows you to customize layers using ‘photoshop-like’ controls and filters. It’s similar to the way you would edit colors/syles in a Mapbox project.
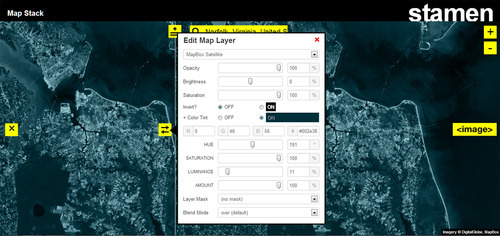
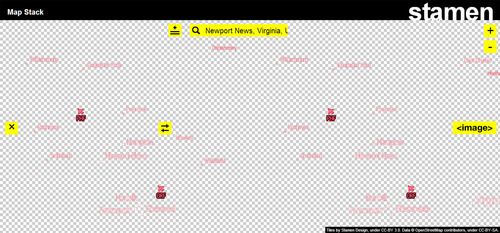
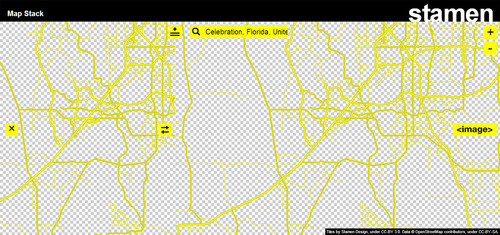
I was able to create some truly unique map layers - a dark blue filter over satellite imagery, pink map labels, and yellow streets. You can see some experimenting in ArcGIS Online I did here. Using MapStack is cool but, as read on their page it’s still an experiment of sorts , meaning: DO NOT DEPEND ON IT TO BE UP AND RUNNING 24/7.
Adding Tile Layers In ArcGIS Online
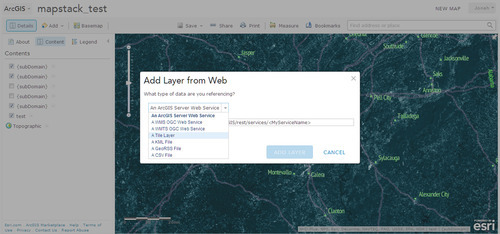
Login to your ArcGIS Online account and open a new or existing web map. Add > Add Layer from Web > A Tile Layer
In another browser tab, you’ll want to have your map of choice open in it’s web map form. Depending on your browser you can use the ‘Inspect Element’ feature or you can right-click ‘Open Image In New Tab’ to get the URL for the tile layer you are using.
Here is an example of an image tile URL from the Stamen watercolor service:
http://d.tile.stamen.com/watercolor/12/654/1583.jpg
- Here is an example of an image tile URL from a Mapbox Style with the API Token attached:
https://b.tiles.mapbox.com/v4/jonahadkins.f7dcdf2b/12/1177/1592.png? access_token=pk.insertyourownapitoken
- Use that URL pattern fill out the URL in the tile layer dialogue box.
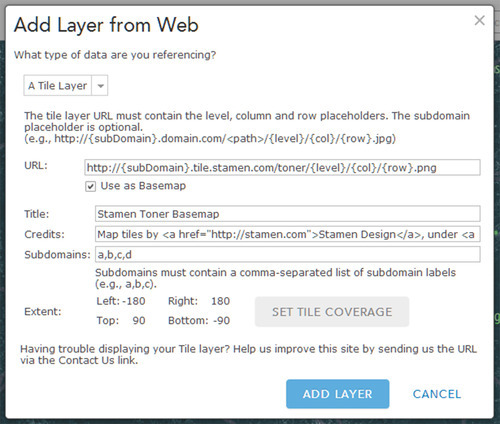
Make the following substitutions:
- Replace the first letter, usually a,b,c, or d with {subDomain)
- Replace the level, column, and row numbers with {level}/{col}/{row}
- Don’t forget the .png on the end - most tile layers I came across were png, but double-check to make sure
- If you want to use your tile layer as the basemap, simply check the box
Credits, as read on Stamen’s page, insert this:> Map tiles by <a href=”http://stamen.com”>Stamen Design</a>, under <a href=”http://creativecommons.org/licenses/by/3.0”>CC BY 3.0</a>. Data by <a href=”http://openstreetmap.org”>OpenStreetMap</a>, under <a href=”http://creativecommons.org/licenses/by-sa/3.0”>CC BY SA</a>.
Credits, as read on Mapbox’s page, insert this:> Data by <a href=”http://openstreetmap.org”>OpenStreetMap</a>, under <a href=”http://creativecommons.org/licenses/by-sa/3.0”>CC BY SA</a>, Design by Mapbox, Licensed According To Terms Of Service <a href=”http://mapbox.com/tos/”>MapBox Terms Of Service</a>
For an imagery layer, add this:> Imagery by Digital Globe, Mapbox, Licensed According To Terms Of Service <a href=”http://mapbox.com/tos/”>MapBox Terms Of Service</a>
- Under subdomains, you will insert the a,b,c,d you replaced above.
- Use the ‘Set Tile Coverage’ if required for your project.
- Finally, Add Layer
The same should work for most ‘open’ tile layer services like:
Just make sure you check the usage and attribution before heavy-use.
Feel free to give me a shout on Twitter @jonahadkins for any comments or questions. And please fork to add any missing info or lessons learned.